The Stock Market Stress Test
When the tide goes out you can see who has been swimming naked. Warren Buffett
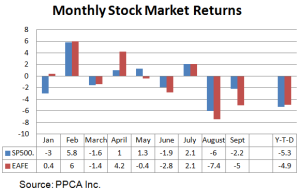
The S&P500 lost 6.5% in the third quarter and EAFE lost 10%. This is the worst quarter since Q3 2011. We’re not used to losing money. As a result of these losses, broad market indexes both here and abroad are down for the year to date. The S&P500 has lost 5.3% and EAFE has lost about the same, with a 4.9% loss. As we began the year, I forecast double digit losses for 2015. If I’m right, markets will decline by at least another 5% in the coming quarter – another shoe will drop. Of course I’d like to be wrong this time.
On the bright side, September is now behind us. As you can see in the graph on the right, September has historically been the most disappointing month for U.S. stock investors. December has been the best month, so we have that to look forward to.
Impact on Retirement Savings
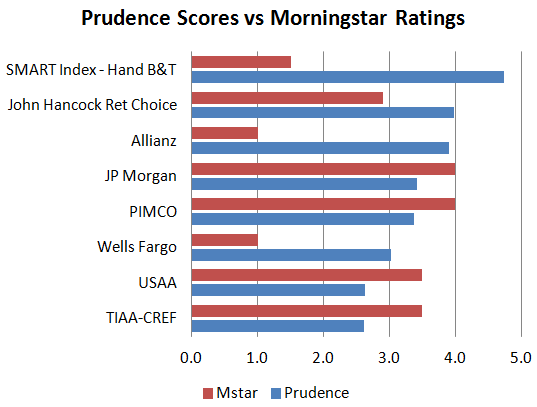
The media customarily puts stock market losses into perspective by reporting on typical dollar losses in 401(k) plans, especially target date funds (TDFs). It’s estimated that the typical participant has lost $5,000 so far this year. At $1 Trillion and growing, TDFs are about 25% of all 401(k) assets, moving toward 50% over the next 5 years. The last time TDFs were stress tested was 2008, and they failed miserably. This past 9 months provides a clue to what might happen if there were another 2008. Until now, riskier TDFs got high ratings because risk, especially investments in U.S. stocks, has been rewarded. As a counterbalance, we’ve developed Prudence Scores based on three key criteria. High returns can be an indication of imprudent risk taking. High prudence ratings should protect in a downtrend. Here are the top 8 TDFs with comparisons to their Morningstar ratings:
As Warren Buffet observed, as this tide rolls out we’ll see who has been swimming naked.
Diversification
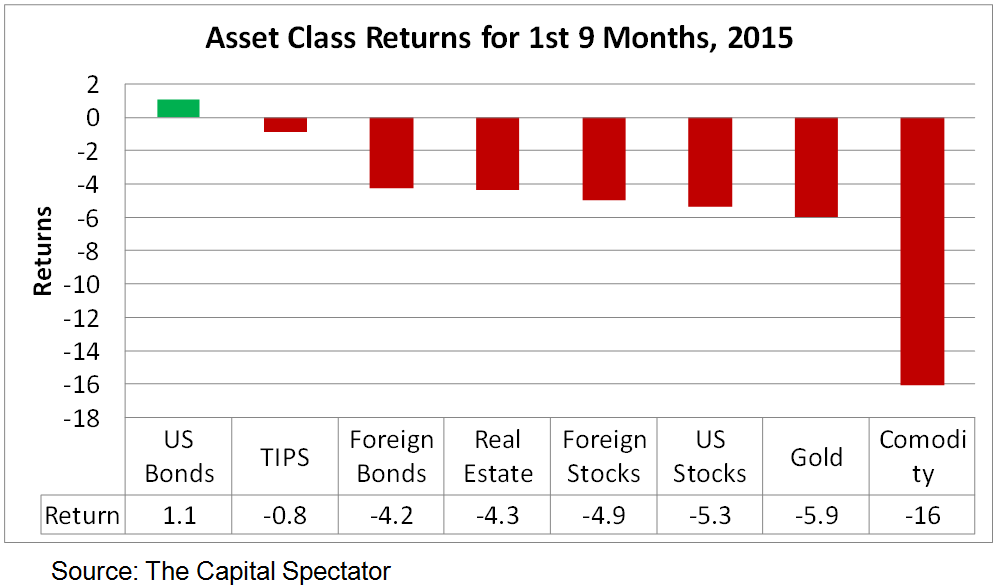
Diversification into alternatives, especially commodities, has not helped in 2015. The only asset with (slightly) positive returns has been U.S. bonds. This is important to understand when evaluating multi-asset portfolios, including TDFs. Diversification is intended to smooth out the ride, to mitigate losses. It just hasn’t “worked” so far this year.
Here’s What Has Passed this Stress Test
In the following I report on the details of U.S. and foreign stock market performance. As you’ll see, some market segments have passed the stress test but most have failed. It’s been tough.
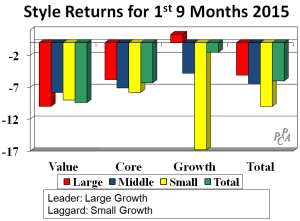
Growth stocks have been the best and the worst style in the year-to-date. Large growth companies are the only stocks with a positive return, earning 1.3%. It’s surprising that growth stocks have protected in a declining market. On the other end of the size spectrum, small cap growth stocks have suffered a substantial 17% loss. I use Surz Style Pure® classifications throughout this commentary.
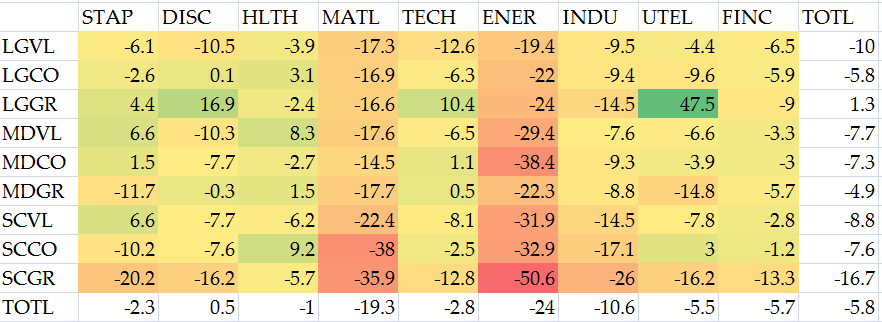
Most of the return in large growth companies came from Consumer Discretionary stocks and Utilities-and-Phones. As shown in the graph 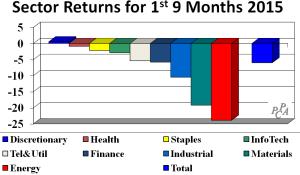 on the right, the Consumer Discretionary sector was the only sector that passed the stress test, eking out a 0.5% return. Note that the so-called “Chindia” infrastructure sectors – Industrials, Materials and Energy -- have been the worst performing, attributable primarily to the slowdown in China’s growth.
Drilling deeper into US market segments, the following heat map shows performance within style-sector cross-sections, where we see that large-cap growth Utility stocks have performed best with a 47.5% return, while small-cap growth Energy stocks have lost the most, with a 50.6% loss. That’s a whopping 98% spread!
Foreign Stocks
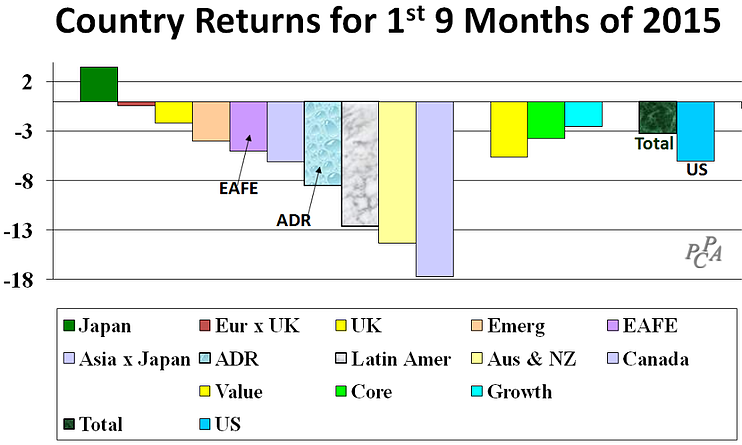
Looking outside the US, foreign markets lost 3.2% in $U.S., exceeding the U.S. stock market’s 6% loss and EAFE’s 5% loss. Unlike the US, smaller companies have performed best, earning 2% versus a 4% loss for the rest of the market. But like the US, growth stocks have led with a 2.5% loss, while the rest of the market has lost 4%.
Note that the worst performing countries – Australia, New Zealand and Canada – are resource rich during a period when commodities and natural resources have suffered in value.
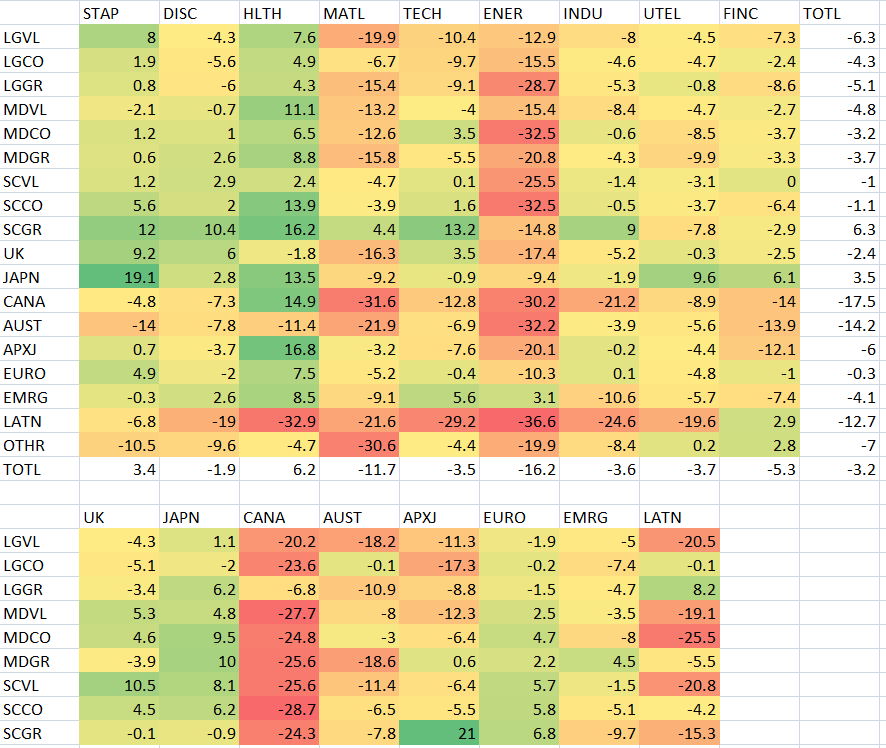
Looking in more detail into foreign markets, the following heat maps show sector-style-country cross-sections. As you can see, small cap growth stocks in Asia ex Japan have earned 21%, in contrast to 32.9% losses in Latin American Healthcare companies.
How to Use This Information
It just keeps getting better, until it doesn’t. After 5 years of extraordinary growth, stock markets have finally shown signs of weakening. No one knows what lies ahead, but we all have outlooks on the economy and the stock market, and adjust our thinking as results roll in. I personally remain surprised and grateful that stocks have performed so well in the past 5 years, following the 2008-2009 meltdown; it’s been a long-term reversal. We can use the information above to test our personal outlooks, to see which are unfolding as we think they should and which are not, with the intention to clear the haze from those crystal balls.
We can also use this information to evaluate our investment managers, and to put an end to the continuing disappointments from active investment managers. Specifically, we need to stop using peer groups because we invariably end up hiring losers.
- It’s become self-evident recently that peer groups suffer from “loser bias” because the majority of active managers underperform their benchmark.
- Beating the losers is not a “win.” Peer group comparisons simply don’t work anymore.
- Beating the benchmark is a good beginning, especially when combined with a statistical test of significance called a “Success Score.” We can use the benchmarks in this report, and evaluate winners with Success Scores. Losers need not apply.
In the “good old days,” investment managers had two shots at winning. They could beat their index or they could beat the median manager in their peer group. That peer group thing doesn’t work anymore. Due to the popularity of passive ETFs and the emergence of Robo Advisors, there is only one pertinent yardstick – beating the benchmark. Unfortunately, less than 20% of active managers achieve this measure of success.
This active manager failure renders peer groups worse than useless. It is now well-understood that peer groups suffer from “loser bias,” in addition to survivor and classification biases. Loser bias is the reality that more than 80% of the managers in a peer group are losers since they fail to beat their benchmarks. Beating the losers is like winning the prize for best ballerina in Waco.
So the new definition of “success” is beating the benchmark, but there’s more to winning than this simple measure. We want to know that success is not just luck -- that it is likely to repeat in the future. That’s where statistics and “Success Scores” come in. We call it a “win” if the outperformance of the benchmark is statistically significant. Success Scores are the statistical significance of benchmark outperformance.
A facsimile of a peer groups is created by forming all the portfolios that could be formed from the stocks in the index. A ranking against these Success Scores in the top decile is significant at the 90% confidence level – we can be 90% sure that it wasn’t just luck.
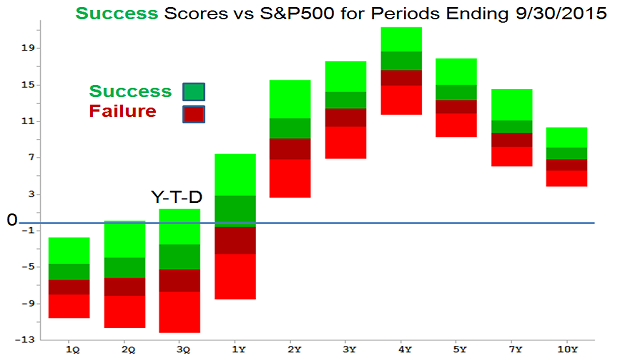
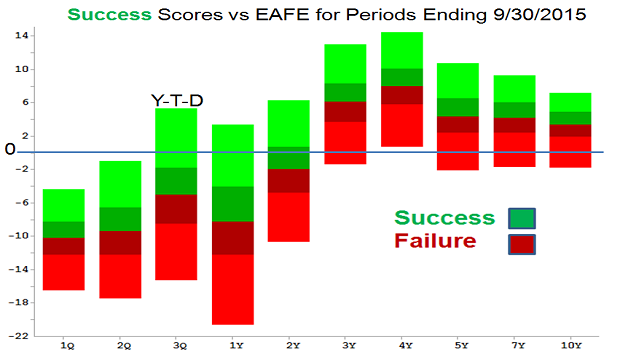
Success Scores are bias free and available a day or two after quarter end. It’s not enough to beat the benchmark. An investment manager needs to beat his benchmark by a significant amount to be a true winner. Here are Success Scores against the S&P500 and EAFE for periods ending 9/30/2015. Plot your dots in the floating bars.
 Success Scores are especially valuable for hedge funds since hedge fund peer groups are just plain silly. The beauty of hedge funds is their uniqueness – no two are alike. “Unique” means “without peers.”
To learn more about Ron Surz, visit PPCA, Inc.

