Market Opportunity Knocking on the 2016 Door - The Future
In our first commentary we set the stage for capitalizing on market opportunities in 2016 by examining 2015 and the past 5 years. Now we provide specific ideas for you to consider.
In Searching for Alpha in Heat Maps, published in early April, 2013 I showed how heat maps could be used to profit from momentum effects. I then published my forecasts each quarter, and momentum effects “worked”, with winners continuing to win and losers continuing to lose.
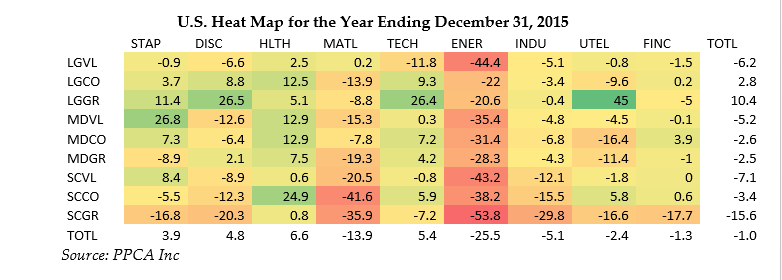
So now I’ll offer forecasts for the first quarter of 2016 using heat maps. A heat map shows shades of green for “good,” which in this case is good performance relative to the total market. By contrast, shades of red are bad, indicating underperformance. Yellow is neutral.
The table below is the U.S. heat map for the year ending December 31, 2015. We see that the best performing market segments are mostly in the healthcare sector and the large cap growth style. These would be the stocks to bet on if you want to make a momentum bet. Of course you could make a contrarion bet that these sectors will not do well.
As for underperforming segments, energy and materials stocks are the place to look, especially smaller companies in these sectors.
Many quantitative managers employ momentum in their models, buying the “green” and selling the “red.” Fundamental managers use heat maps as clues to segments of the market that are worth exploring, for both momentum and reversal potential.
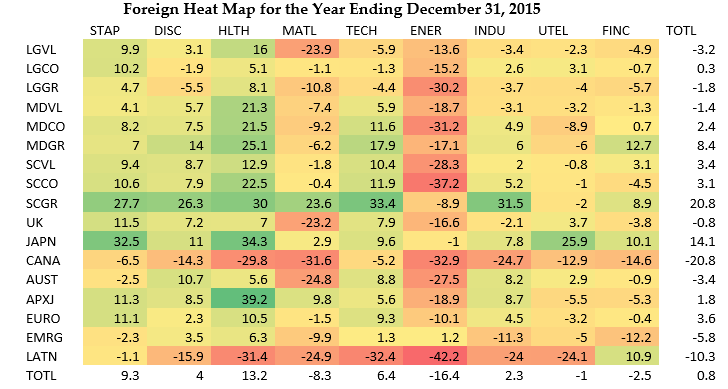
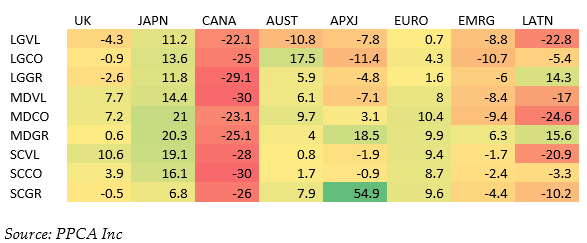
Moving outside the U.S., the healthcare sector and the small cap growth style thrived in 2015, while energy stocks in all countries and styles have suffered as has Canada.
In forecasting the future, it helps to have an understanding of the past. Those who are unaware of the mistakes of the past are more likely to repeat them. In my final commentary – Part 3: The Past -- I provide a longer term 90-year history of stocks, bonds, T-bills and inflation. There are many lessons to be learned from this history.
Summary of 2016 Opportunities:
From Part 1: 2015 and the past 5 years
- Partner with Surz Style Pure Style Indexes. For example, Centric Core is an exceptionally smart beta that creates smart alpha by bringing out the best in active managers.
- Bet that the U.S. stock market will decline
From this commentary: Decide on momentum or reversal versus 2015:
- Biggest U.S. winner in 2015: Large cap Growth (11%)
- Biggest U.S. loser: Small cap growth (-10%)
- Biggest global winner: Healthcare (8%)
- Biggest global losers: Energy (-14%), Materials (-8%)
- Biggest foreign winners: Small cap growth (18%), Japan (13%)
- Biggest foreign loser: Canada (-15%)
My final commentary in this series looks back over the 90-year history of capital markets.
Ronald J. Surz is president of PPCA Inc. and Target Date Solutions in San Clemente, California. He is also a partner and CIO of Paladin Financial Technology, TDF Builder, and Sortino Investment Analytics.


