
by Dr. Frank Sortino and Ron Surz
Investors have financial goals that advisors help them achieve. Most financial advisors manage to objectives, and most use Modern Portfolio Theory (MPT) to find a suitable asset mix. MPT is more than 60 years old. There’s a better modern way to manage to objectives that improves the chances that the client will actually succeed.
Current portfolio construction evolves from a 2-step process:
- Translate client objectives into a desired target rate of return (DTR) that brings current assets plus future cash flows in line with a terminal wealth.
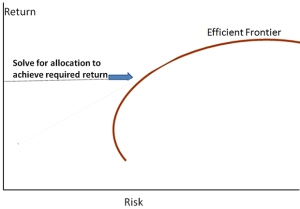
- Use MPT to “locate” the “right” asset mix on the efficient frontier, as shown in the graph on the right. This solution produces the lowest risk asset mix for a given expected return.

Note that risk in an MPT world is defined as volatility, or standard deviation, and is independent of the DTR. Volatility is the same regardless of the DTR. MPT assumes every investor thinks and acts the same in equilibrium so one efficient frontier fits all.
Enter PMPT
A new modern day approach has been developed by Dr. Frank Sortino. Post Modern Portfolio Theory (PMPT) views risk as the possibility of failing to achieve an objective. Risk in a PMPT world is DTR-specific. For example, if we need to earn 8% to achieve our goals, cash is a high risk asset because we’re not going to succeed with cash. By contrast cash is always low risk in an MPT world.
Improving the odds
PMPT’s asset mix solution is different than MPTs and different for each DTR. PMPT can improve the odds of achieving the DTR while simultaneously reducing the degree of potential disappointment: Better upside potential for the downside risk.
- For each objective and associated DTR, measure reward as the potential to exceed the DTR, and risk as volatility below the DTR. Using the Surz indexes (mutually exclusive and exhaustive), generate a passive
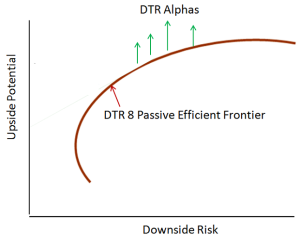 efficient frontier for each DTR that maximizes the potential to exceed the DTR relative to the downside risk of falling below the DTR. A DTR 8 efficient frontier is shown in the graph on the right.
 - Superimpose on that efficient frontier, all the possible combinations of active managers and passive indexes that will exactly fill the allocations to each asset category and provide a higher return adjusted for downside risk (arrows above the efficient frontier). Choose the portfolio with the highest arrow. This is the upside potential ratio framework.

Then after establishing an asset mix, track progress toward achieving objectives, and adjust as necessary. Measure the client’s performance relative to the DTR.
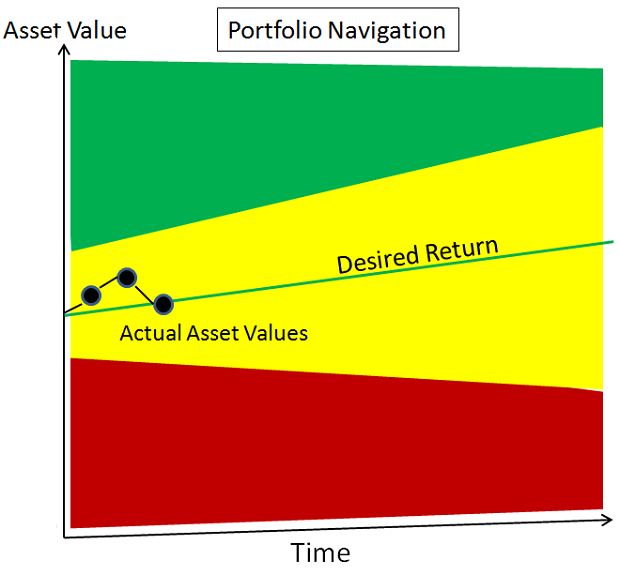
The Pension Research Institute (PRI) started an 8% DTR research project on February 1 of this year. Progress is shown in the graph above. For every $100,000 invested, an investor would be $58.55 behind target thus far. The portfolio earned 1.88% in 3 months versus a 1.94% 3-month DTR. During this period the S&P 500 earned 5% and reached an all time high. However, the PRI portfolio was 40% or less in equity for this interval. Should beating the market be the investment objective? Or, should beating one’s DTR be the client’s objective? Is all volatility risky, or only the downside risk? For more detail see www.pmpt.me.
Article co-authored by Ron Surz and Dr. Frank Sortino. Visit PPCA, Inc. to learn more.